United
States (USA)
United
States (USA)
 Canada
(CAD)
Canada
(CAD)
 Spain (ESP)

100,000++ Happy Customers


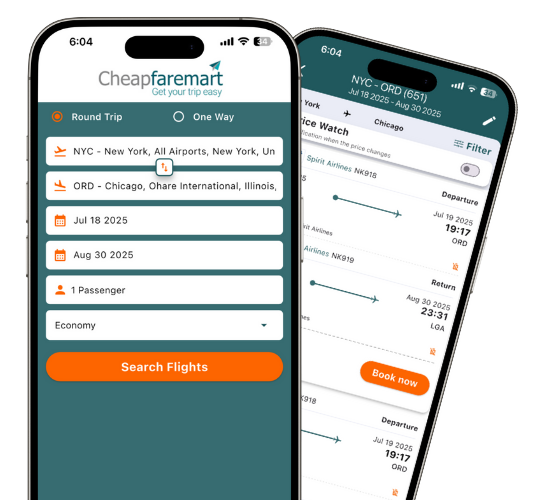
EXCLUSIVE PHONE
ONLY DEALS!
ONLY DEALS!
✓ Free Baggage Protection
✓ 24 Hour free cancellation

100,000+
happy customers